When the “Data Scientist” monicker first entered the global vocabulary, one of the jokes at the time was:
q). What is a Data Scientist?
a). A Statistician in Silicon Valley
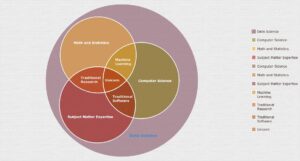
As often happens, there was no single definition of a Data Scientist. Venn diagrams appeared.
Many of them, like this one, made an interesting point:
( Courtesy of Anychart: https://playground.anychart.com/gallery/src/Venn_Diagram/Data_Science )
Is there anyone who covers all these areas well enough? Do Data Science Unicorns exist?
The more “experienced” (i.e. older/often sceptical) practitioners in the field wondered whether the term would stand the test of time.
Stand the test of time it has.
As I write this, I checked, and LinkedIn has 681 job posts with “statistician” in them somewhere. 1,139 posts mention “data scientist”.
One key stream in parallel to this new discipline was the growth of open-source tech. The tech was predominately code-based. So, one central skill a data scientist required was (/is) the ability to code.
Until this point, there had been a direction of travel in Data Analytics (I will use that label for now as an umbrella for Business Intelligence (BI), Analytics, Statistics, Data Mining, Predictive Analytics, Machine Learning, etc.). To make the process of answering/solving analytical problems, however complex, more visual, automated, and productive. This was achieved through visual User Interfaces like SAS Enterprise Miner, IBM/SPSS Modeler, Rapid Miner, KNIME and others. Not to mention the plethora of friendly UIs in Statistics and BI.
Naturally, the new breed of data scientists tended to be part of the “Computer science” circle in Venn. They were essentially more technical. Python and R emerged as open-source alternatives to commercial (now more visual) analytical tools in parallel.
This technical shift has been compounded in recent years as more tech effort and tooling has been required to get the results of analytics, models and pipelines, deployed into operational systems. MLOps came into being.
The risk with all of this is that the role of the analyst has been somewhat lost in the fog. Data Scientists can get caught up in technical tasks that neglect the importance of being able to analyse, interpret and translate the content of the whole endeavour. To get close to what the numbers mean.
AutoML is a case in point. Automated Machine Learning is a process that automates machine learning model selection, training, and optimisation. I recall passionate discussions in the late 90s about whether letting the machine do this for the analyst was a good idea. We’ve often said that it is a helpful first step. A “range-finder”, if you like, which is part of a hybrid approach. It can get the data scientist to a starting point where they can apply their expertise. I was chuffed to hear an Engineer on the Databricks stand at the recent Big Data LDN conference echo that approach.
We would also advocate that Business/Data Understanding before Data Preparation and Modelling (as per CRISP-DM/DS) is critical even if you apply some of the automated Data Prep/Feature Engineering methods. Here is an excellent post by Dan Cleypaul on Medium that reflects that and emphasises the importance of “Analytical” skills in the Data Science process. He talks about EDA (Exploratory Data Analysis), which is very much grounded in Statistical practice and the work of John Tukey.
So, where does that leave us when it comes to getting Data Science done more effectively? Increasingly, particularly in larger teams, defined roles often split out business analysts and data scientists. Roles like MLOps developer have emerged to cover more of the tech side of the process. But what about smaller teams?
As always, the more polymath a data scientist or an analyst can have, the more effective they are likely to be in everything they do. In other words, let’s all try to be more like “Unicorns”!

